시계열 데이터베이스 사용하기
2. InfluxDB 이용한 모니터링 대시보드

0. InfluxDB를 이용한 시스템 모니터링
프로그램을 개발하다 보면 모니터링이 필요하다는 생각이 자주 든다. 여러 모듈들이 연결되어 있는 서비스의 경우 서비스의 흐름을 따라 각 모듈의 로그를 보면서 문제점을 찾아야 하는데, 개발할 때마다 쉽게 찾을 수 있는 방법이 있었으면 하는 생각이 들곤 한다. 로그에서 내용을 찾을 때 가장 유용했던 프로그램이 내 경우에는 ELK (Elastic Search / Logstach / Kibana) 였던 것 같다. 다음에 한번 ELK에 대해서도 정리해 놓아야겠다.
하지만, 모듈들 연결되고 동작하기 시작하면 다음 고민은 내가 만든 프로그램이 서버에서 문제없이 잘 동작하는지에 대한 궁금증이다.
- 메모리는 어느 정도 사용하는지?
- CPU에는 어느 정도 부하를 주는지?
- network은 얼마나 사용하는지?
- 디스크 IO에는 얼마나 발생하는지?
- 데이터베이스는 얼마나 자주 사용하는지?
- 또는 데이터베이스에 얼마나 부하를 주는지?
와 같이 많은 궁금증이 떠오른다. 물론, 모든 것을 면밀하게 살피기 위해서는 성능 테스트를 포함한 다면적인 테스트가 필요하겠지만, 개발하는 동안에도 노트북 팬이 조금만 많이 돌아도 생기는 비 기능적인 궁금증을 손쉽게 해결해 볼 수 있는 것이 Telegraf - Influxdb - Grafana로 구성된 오픈소스 분석 도구이지 않을까 생각된다. 운영환경에 적용해도 손색이 없는 조합이지만, 간단하게 Docker로 구성해 놓으면 언제든 필요할 때 불러서 사용할 수 있어 편리하다.
1. Telegraf Configuration 만드는 방법이 바뀌었다!
공교롭게도, 지난번에 만들었던 influxDB docker 컨테이너를 docker로 다시 최신버전(latest)으로 만들었더니, 처음 보이던 "Getting Started"화면이 바뀌면서 Telegraf의 configuration을 만드는 Wizzard도 같이 사라졌다.
그래서 Configuration을 다시 만들기 위해 아래와 같이 진행했다.
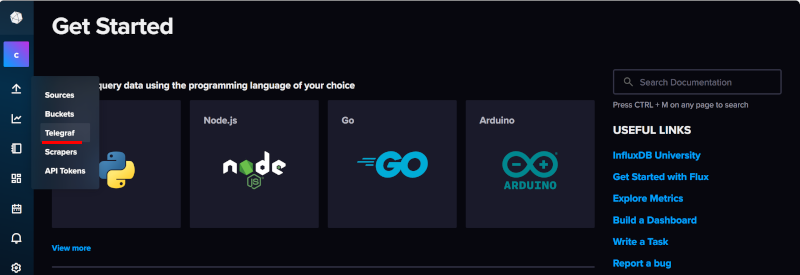
- InfluxDB화면 왼쪽 아이콘 메뉴에서 위 화살표 아이콘을 선택하면 나타나는 하위 메뉴 중 Telegraf를 선택한다.
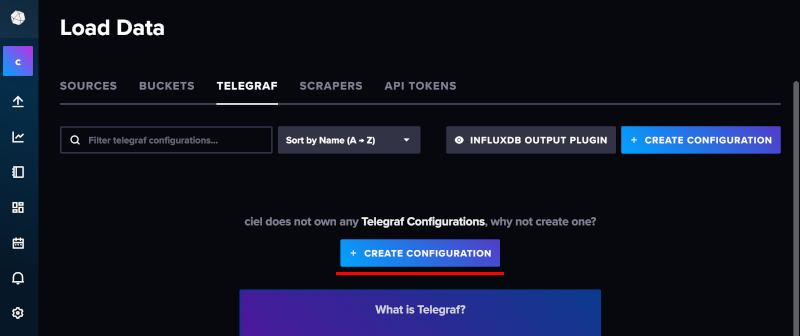
- "Load Data"화면에서 "Create Configuration"를 누른다.
- Bucket을 선택하고 데이터를 수집할 대상, 즉 모니터링할 대상을 선택하고 "Continue Configuration"을 누른다.

- "Configuration Name"에 화면에 나타낼 이름을 넣고 Description에 간단한 설명을 넣은 다음 Text입력 박스에 있는 Configuration 정보를 수정한다.
기본적으로 Configuration에 담겨있는 모든 설정값들은 주석으로 처리되어 놨으니, 필요한 부분의 주석을 풀고 편집해서 사용한다. 나는 화면에서 편집하는 것이 불편해서, VSCode에 내용을 복사한 다음 주석을 제거하고 다시 복사해 넣었다.

나중에라도 간단하게 복사해서 테스트해 볼 수 있도록 Windows Performance에 대한 Telegraf Configuration을 필요한 부분의 주석을 제거한 다음 아래에 복사해 놓았다.
# Input plugin to counterPath Performance Counters on Windows operating systems
[[inputs.win_perf_counters]]
  ## By default this plugin returns basic CPU and Disk statistics.
  ## See the README file for more examples.
  ## Uncomment examples below or write your own as you see fit. If the system
  ## being polled for data does not have the Object at startup of the Telegraf
  ## agent, it will not be gathered.
  ## Settings:
  # PrintValid = false # Print All matching performance counters
  # Whether request a timestamp along with the PerfCounter data or just use current time
  # UsePerfCounterTime=true
  # If UseWildcardsExpansion params is set to true, wildcards (partial wildcards in instance names and wildcards in counters names) in configured counter paths will be expanded
  # and in case of localized Windows, counter paths will be also localized. It also returns instance indexes in instance names.
  # If false, wildcards (not partial) in instance names will still be expanded, but instance indexes will not be returned in instance names.
  #UseWildcardsExpansion = false
  # When running on a localized version of Windows and with UseWildcardsExpansion = true, Windows will
  # localize object and counter names. When LocalizeWildcardsExpansion = false, use the names in object.Counters instead
  # of the localized names. Only Instances can have wildcards in this case. ObjectName and Counters must not have wildcards when this
  # setting is false.
  #LocalizeWildcardsExpansion = true
  # Period after which counters will be reread from configuration and wildcards in counter paths expanded
  CountersRefreshInterval="1m"
  ## Accepts a list of PDH error codes which are defined in pdh.go, if this error is encountered it will be ignored
  ## For example, you can provide "PDH_NO_DATA" to ignore performance counters with no instances
  ## By default no errors are ignored
  ## You can find the list here: https://github.com/influxdata/telegraf/blob/master/plugins/inputs/win_perf_counters/pdh.go
  ## e.g.: IgnoredErrors = ["PDH_NO_DATA"]
  # IgnoredErrors = []

  [[inputs.win_perf_counters.object]]
    # Processor usage, alternative to native, reports on a per core.
    ObjectName = "Processor"
    Instances = ["*"]
    Counters = [
      "% Idle Time",
      "% Interrupt Time",
      "% Privileged Time",
      "% User Time",
      "% Processor Time",
      "% DPC Time",
    ]
    Measurement = "win_cpu"
    # Set to true to include _Total instance when querying for all (*).
    # IncludeTotal=false
    # Print out when the performance counter is missing from object, counter or instance.
    # WarnOnMissing = false
    # Gather raw values instead of formatted. Raw value is stored in the field name with the "_Raw" suffix, e.g. "Disk_Read_Bytes_sec_Raw".
    # UseRawValues = true

  [[inputs.win_perf_counters.object]]
    # Disk times and queues
    ObjectName = "LogicalDisk"
    Instances = ["*"]
    Counters = [
      "% Idle Time",
      "% Disk Time",
      "% Disk Read Time",
      "% Disk Write Time",
      "% User Time",
      "% Free Space",
      "Current Disk Queue Length",
      "Free Megabytes",
    ]
    Measurement = "win_disk"

  [[inputs.win_perf_counters.object]]
    ObjectName = "PhysicalDisk"
    Instances = ["*"]
    Counters = [
      "Disk Read Bytes/sec",
      "Disk Write Bytes/sec",
      "Current Disk Queue Length",
      "Disk Reads/sec",
      "Disk Writes/sec",
      "% Disk Time",
      "% Disk Read Time",
      "% Disk Write Time",
    ]
    Measurement = "win_diskio"

  [[inputs.win_perf_counters.object]]
    ObjectName = "Network Interface"
    Instances = ["*"]
    Counters = [
      "Bytes Received/sec",
      "Bytes Sent/sec",
      "Packets Received/sec",
      "Packets Sent/sec",
      "Packets Received Discarded",
      "Packets Outbound Discarded",
      "Packets Received Errors",
      "Packets Outbound Errors",
    ]
    Measurement = "win_net"


  [[inputs.win_perf_counters.object]]
    ObjectName = "System"
    Counters = [
      "Context Switches/sec",
      "System Calls/sec",
      "Processor Queue Length",
      "System Up Time",
    ]
    Instances = ["------"]
    Measurement = "win_system"

  [[inputs.win_perf_counters.object]]
    # Example counterPath where the Instance portion must be removed to get data back,
    # such as from the Memory object.
    ObjectName = "Memory"
    Counters = [
      "Available Bytes",
      "Cache Faults/sec",
      "Demand Zero Faults/sec",
      "Page Faults/sec",
      "Pages/sec",
      "Transition Faults/sec",
      "Pool Nonpaged Bytes",
      "Pool Paged Bytes",
      "Standby Cache Reserve Bytes",
      "Standby Cache Normal Priority Bytes",
      "Standby Cache Core Bytes",
    ]
    Instances = ["------"] # Use 6 x - to remove the Instance bit from the counterPath.
    Measurement = "win_mem"

  [[inputs.win_perf_counters.object]]
    # Example query where the Instance portion must be removed to get data back,
    # such as from the Paging File object.
    ObjectName = "Paging File"
    Counters = [
      "% Usage",
    ]
    Instances = ["_Total"]
    Measurement = "win_swap"
화면의 오른쪽 마지막에 있는 "SAVE AND TEST"를 누르면 나타나는 화면부터는 "1. influxDB 준비하기"에서 한 내용과 비슷한데, 불행히도 Wizard 방색으로 하면 자동으로 만들어지던 대시보드도 이제 만들어지지 않는다.
2. 시계열 데이터 확인하기: influxDB의 Data Explorer
모니터링 대시보드를 만들기 전에 먼저, influxDB의 "Data Explorer"화면을 사용하면 query로 데이터를 선택해서 여러 가지 시각화 방법으로 내용을 미리 확인해 볼 수 있다.
- InfluxDB화면 왼쪽 메뉴에서 두 번째 아이콘을 선택하면 Data Explorer화면으로 이동한다.
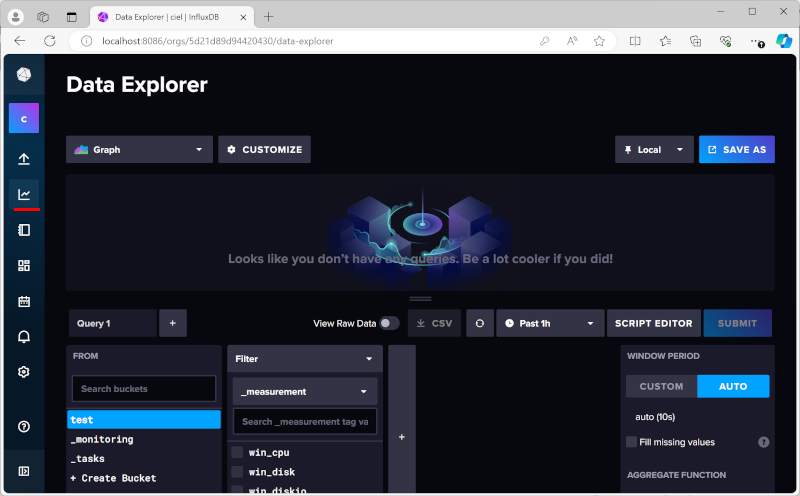
- 화면에 표시힐 시각화 방법을 선택한다
그래프(Graph), 계기판에서 보던 게이지(Guage), 히트맵(Heatmap), 히스토그램(Histogram), 또는 테이블(Table)로 표시하는 방법 등을 선택할 수 있다.

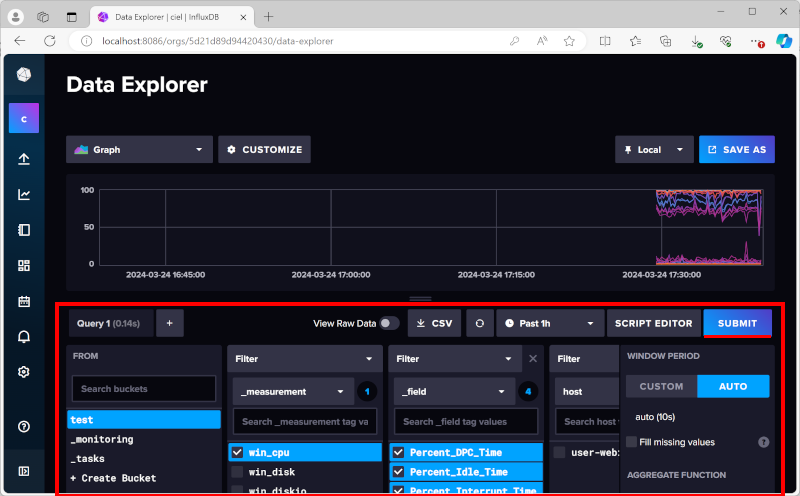
- 시각화에 필요한 데이터를 선택하는 Query를 만든다.
왼쪽부터 bucket(아래의 경우 "test")을 선택하고, measurement(아래의 경우 "win_cpu")를 선택하고, field(아랭의 경우 "Percent_DPC_Time", "Percent_Idle_Time", "Percent_Interrupt_Time", "Percent_Privileged_Time")를 선택하고 Submit 하면 선택한 그래프가 나타난다.
3. 모니터링 대시보드: influxDB의 Dashboards
모니터링 대시보드를 만들기 위해 influxDB의 dashboards기능을 왼쪽 메뉴에서 선택하고 "Create dashboard"를 선택하고 "New Dashboard"를 선택해서 새로운 대시보드 만들기를 시작한다.
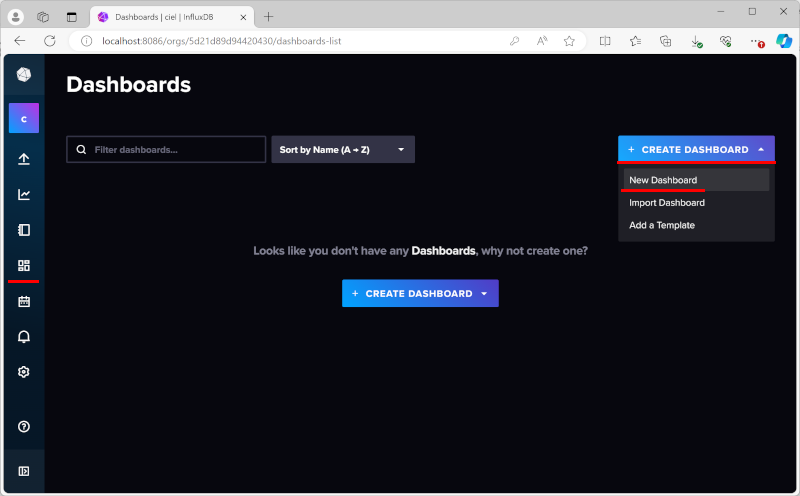
가장 위에 나타나는 "Name this Dashboard"로 나타난 부분을 선택하고 대시보드의 이름을 입력한 다음, "Add Cell"을 선택해서 대시보드에 나타낼 시각화 대상들을 하나씩 추가한다.

가장 위에 나타나는 "Name this Cell"을 원하는 이름으로 바꾸고 아래 "Data Explorer"에서 처럼 시각화 방법을 선택하고 qeury를 구성하고 나서 마지막에 오른쪽 위에 있는 체크버튼을 누르면 Cell이 추가된다.

Cell을 하나 더 추가하면 기본적으로 밑으로 추가되는데, Cell의 왼쪽 위에 바둑판 모양의 아이콘을 마우스로 끌어서 원하는 위치로 옮기면 된다. 이제 "SET AUTO REFRESH"를 선택하고 화면의 그래프가 자동으로 업데이트되도록 하면 기본적인 대시보드가 완성된다.
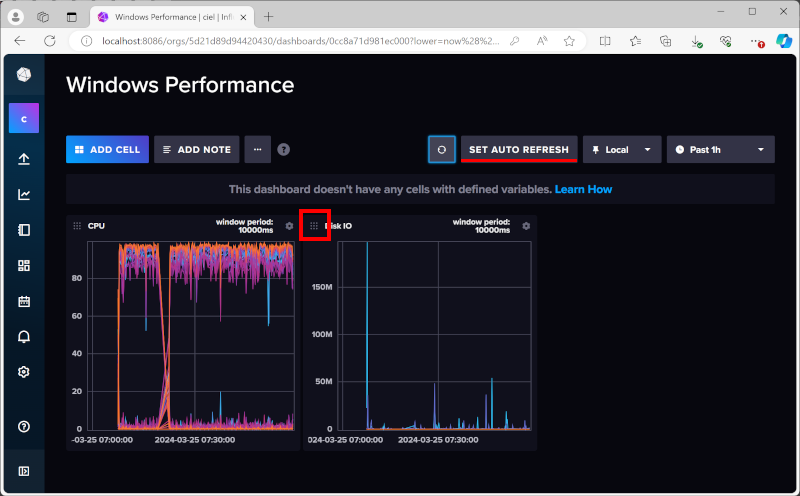
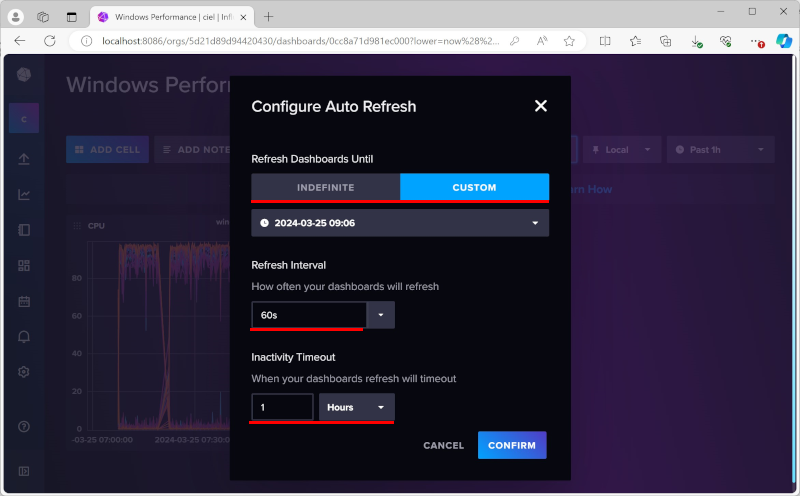
이렇게 만들어진 대시보드는 자동 화면이 변하지 않기 때문에 모니터링 화면처럼 데이터에 따라 그래프가 변화하게 하기 위해서는 "SET AUTO REFRESH"를 선택하고 모달 창에 몇 초마다 화면을 업데이트할 것인지를 "Refresh Interval"에서 설정하고 Confirm을 누르면 모니터링 화면처럼 그래프가 변한다.
'윈도우 개발환경' 카테고리의 다른 글
| 쿠버네티스로 MSA DevOps 환경 구축; 4. 포트포워딩 없는 Minikube (0) | 2024.08.23 |
|---|---|
| 쿠버네티스로 MSA DevOps 환경 구축; 3. Pod, Service, Deployment (1) | 2024.08.18 |
| 쿠버네티스로 MSA DevOps 환경 구축; 2. 로컬 컨테이너 Registry (0) | 2024.02.23 |
| 시계열 데이터베이스 사용하기; 1. InfluxDB 준비하기 (2) | 2024.02.20 |
| 쿠버네티스로 MSA DevOps 환경 구축; 1. 로컬 쿠버네티스 설치 (0) | 2024.02.15 |


