
엘라스틱서치(ELK)로 만드는 모니터링 시스템
3. Filebeat - App Log수집

3. 파이썬 프로그램 Logging
ELK는 PostgreSQL서버와 같은 시스템 모니터링에도 유용하지만, 개발 프로그램의 로그 모니터링에 더 유용한 검색엔진이다. 시계열 기반의 메트릭 정보는 대부분 수치로 이루어진 정형적인 정보이어서, Elasticsearch가 시계열 DB보다 성능이 떨어질 수 있는데, 로그는 글자로 이루어진 비정형 데이터를 기반으로 모니터링을 하기 때문에 검색엔진 Lucene기반의 ELK가 더 나은 분석 결과를 얻을 수 있다. 그래도 성능을 위해 Filebeat의 processors를 사용하거나, Logstash를 사용해서 field로 변환을 하면 더 나은 결과를 얻을 수 있다.
이제 지난번에 사용한 테스트용 FastAPI 파이썬 프로그램에서 ELK로 로그를 보낼 수 있게 수정해 보자.
a. Logger 설정
Java나 Javascript/Typescript와는 달리, 파이썬은 괜찮은 Logger를 core모듈로 제공하기 때문에, Log4j/Slf4j, Winston/Morgan 같은 Logger를 설치할 필요가 없다. 파이썬 Logger에 대한 자세한 내용은 아래 Logging Cookbook을 참고하면 된다.
Logging Cookbook
Author, Vinay Sajip <vinay_sajip at red-dove dot com>,. This page contains a number of recipes related to logging, which have been found useful in the past. For links to tutorial and reference info...
docs.python.org
다른 library와 마찬가지로 logger도 사용하기 전에 먼저 설정을 해야 하는데, 설정에 필요한 내용을 logging 함수로 하나씩 설정하는 방법도 있고, 설정할 내용을 json이나 yaml로 만든 다음 파이썬의 dict 오브젝트로 불러들여서 logging의 dictConfig로 설정하는 방법이 있는데, 두 번째 방법이 사용하기도 편하고 관리하기도 편하다.
먼저 아래 내용을 "log_config.yaml"로 저장한다.
---
version: 1
disable_existing_loggers: False

formatters:
  simple:
    format: "%(asctime)s - %(name)s - %(levelname)s - %(message)s"

handlers:
  file_handler:
    class: logging.handlers.RotatingFileHandler
    level: INFO
    formatter: simple
    filename: user-api.log
    maxBytes: 10485760
    backupCount: 5
    encoding: utf8

root:
  level: ERROR
  handlers: [file_handler]
- log의 저장형식을 지정하는 formatters는 날짜(%(asctime)), 대상이름(%(name)), 로그레벨(%(levelname))과 메시지(%(message)) 를 " - "로 분리해서 저장하도록 지정했다.
- 실제 log를 저장하는 역할을 하는 handler는 RotatingFileHandler를 사용했고, filename은 user-api.log로 하고 10M가 넘으면 5개까지만 보관하면서 지우도록 했다.
- 마지막으로 file_handler가 모든 영역 (root)의 log handler가 되도록 지정했다.
b. 파이썬 프로그램에 logger 추가
파이썬 프로그램도 logger를 사용하기 위해 내용을 추가해야 하는데, # <<<<와 # >>>>로 둘러싼 부분이 앞에서 만든 "log_config.yaml"파일을 읽고 logger를 설정하는 부분이고, API 요청을 처리하는 부분에 logger를 사용해서 "Reqest Type, URL path, msg: log 메시지"의 형식으로 log를 남기도록 수정했다.
from fastapi import FastAPI
from pydantic import BaseModel

# <<<< logger의 동작을 설정
import os
import yaml
import logging

def init_logger():
    with open(os.getcwd()+"\\log_config.yaml", 'rt') as f:
        config = yaml.safe_load(f.read())
        logging.config.dictConfig(config)

init_logger()
logger = logging.getLogger(__name__)
logger.setLevel(logging.INFO)
# >>>>

app = FastAPI()

class User(BaseModel):
    userid: str

user = User(userid= 'sam')

@app.get("/")
def read_root():
    logger.info("GET, /, msg: ok")
    return {"User": "API Test"}

@app.get("/user/{user_id}")
def exist_user(user_id: str):
    if user_id != user.userid:
        logger.warn("GET, /user/{user_id}, msg: user '%s' not exist", user_id)
        return {"status": "not exist"}
    logger.info("GET, /user/{user_id}, msg: ser '%s' exist", user_id)
    return {"status": "exist"}
c. 프로그램을 실행하고 log파일 생성
이제, main.py를 FastAPI로 실행하고
fastapi dev main.py
curl을 사용해서 API를 몇 번 액세스 해 보면,
curl http://localhost:8000
curl http://localhost:8000/user/tom
curl http://localhost:8000/user/sam
user-api.log에 설정한 대로 log가 남아 있는 것을 확인할 수 있다.

4. Elasticsearch에 Log 전송
프로그램이 실행될 때 만드는 Log를 Elasticsearch로 보내는 방법에는
- Log file을 읽어서 전송하는 Filebeat를 사용하는 방법
- 프로그램의 Log Handler가 직접 전송하는 방법
등이 있다.
프로그램에서 Log Handler를 사용하는 방법은 마이크로서비스가 사용하는 프로그램 언어와 기술 구조가 통일되어 확정되어 있으면 개발표준을 한 번만 잡으면 되어서 괜찮지만, Node.js, Python 등 개발 언어가 혼재되어 있고 기술 구조가 바뀌고 있으면 Log Handler를 사용하는 방법이 업무량을 늘릴 수 있다.
a. Filebeat을 사용하는 방법
Filebeat quick start: installation and configuration | Filebeat Reference [8.15] | Elastic
To test your configuration file, change to the directory where the Filebeat binary is installed, and run Filebeat in the foreground with the following options specified: ./filebeat test config -e. Make sure your config files are in the path expected by Fil
www.elastic.co
노트북 윈도우에서 개발하는 프로그램의 Log를 수집하기 위해서는 Filebeat Docker를 따로 만들기보다, 직접 프로그램으로 실행하는 것이 더 편리한 것 같아 바로 실행하기로 했다. 물론, 운영으로 배포할 때에는 Docker를 사용하면 된다.
- Filebeat는 설치 프로그램보다 압축을 풀고 바로 실행할 수 있는 .zip 파일을 내려받는다.
공홈에서는 최신 버전만 다운로드 링크만 있기 때문에, 나처럼 이전 버전의 Filebeat프로그램을 받으려면, 아래링크에서 버전만 바꾼 다음 내려받는다.
https://artifacts.elastic.co/downloads/beats/filebeat/filebeat-7.17.23-windows-x86_64.zip
- 압축을 풀고 설정파일, filebeat.yml을 수정한다.
압축을 풀면 생기는 폴더 안에 있는 filebeat.yml파일을 열고 filebeat.inputs과 output을 실행환경에 맞춰 수정한다.
filebeat.inputs는 아래와 같이 변경해서 원하는 log파일을 paths로 지정하고 내용을 tokenizer로 fields로 나누어 output을 통해 전송한다.
...

filebeat.inputs:

- type: filestream

  # Unique ID among all inputs, an ID is required.
  id: my-filestream-id

  # Change to true to enable this input configuration.
  enabled: true

  # Paths that should be crawled and fetched. Glob based paths.
  paths:
    #- /var/log/*.log
    - e:\works\jupyter\notebook\*.log

  processors:
    - dissect:
        tokenizer: "%{@timestamp} - %{msg.name} - %{msg.level} - %{msg.request}, %{msg.path}, msg: %{msg.msg}"
        field: "message"
        target_prefix: "main"

...
- type은 이전에는 log를 사용했는데, filestream으로 바뀌었고,
- id는 구분할 수 있는 이름을 주면 되고,
- enabled를 꼭 true로 바꿔야만 log를 수집(harvest)한다.
- paths는 log의 위치를 지정하는데 테스트용 main.py가 log를 만드는 폴더 위치로 지정했다.
processors부분을 사용하면 Elasticsearch로 Log를 전송할 때 field(DB의 field와 비슷)로 분리해서 전송할 수 있다. Processors의 Tokenizer를 만들 때에는 아래와 같이 미리 결과를 테스트해 볼 수 있는 곳이 있으니 사용하면 편리하다.
Dissect Pattern Tester and Matcher for Filebeat, Elasticsearch and Logstash
beats v7.9 introduced a new feature that allows converting a field from a string (only data type supported until now) into one of integer, long, float, double, boolean, or ip. This type conversion step was usually delegated to a later step in your processi
dissect-tester.jorgelbg.me
output은 Elasticsearch로 바로 보내도록 설정하기 위해 아래와 같이 변경했다.
...
output.elasticsearch:
  hosts: ["http://192.168.59.102:9200"]
...
- filebeat를 실행하고 결과를 확인한다.
설정 파일을 저장했으면, 그 위치에서 바로 실행하면 된다. Filebeat이 잘 실행되는지 확인하고 싶으면, debug모드로 실행하고 화면에서 로그를 확인하면 된다
filebeat -e -d "*"
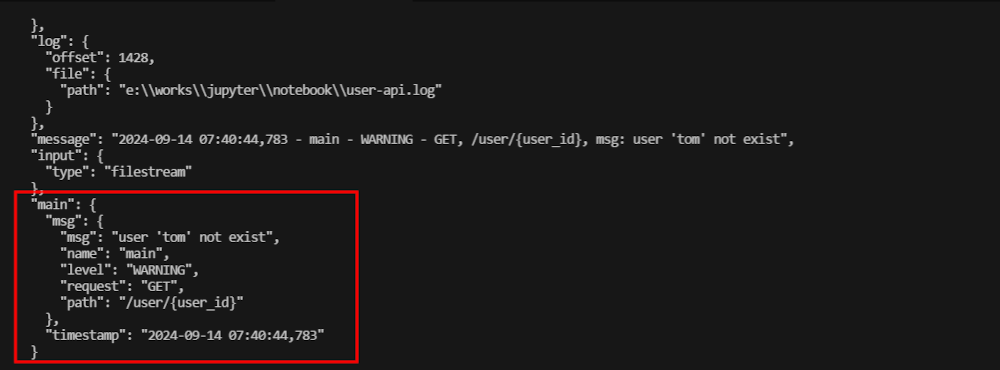
dissect와 tokenizer가 잘 동작하는지 Log에서 확인해 보면, 아래와 같이 잘 동작하는 것을 확인할 수 있고,
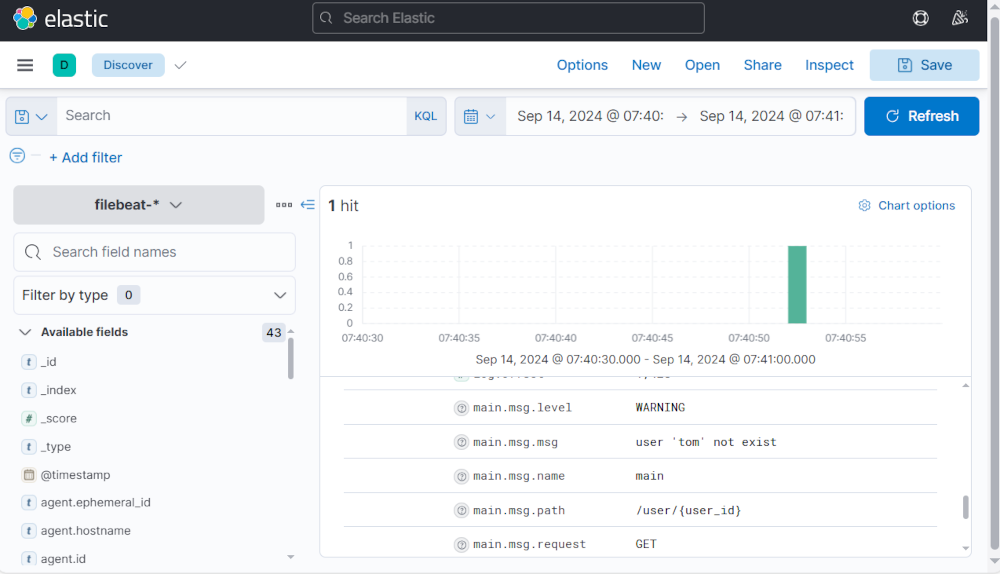
Kibana에서도 결과를 확인할 수 있다.
'프로그램 개발' 카테고리의 다른 글
| NestJS 개발 시작하기(로그인 인증 개발); 2. NestJS CLI로 개발시작 (0) | 2024.09.21 |
|---|---|
| NestJS 개발 시작하기(로그인 인증 개발); 1. NestJS와 Spring의 비교 (4) | 2024.09.17 |
| Starter Template으로 시작하는 Next.js; 2. 실행하기 (1) | 2024.01.01 |
| Starter Template으로 시작하는 Next.js; 1. GitHub에 복사하기 (1) | 2024.01.01 |
| node.js + express.js 로 만드는 Edge Server; 2. Request Handler + MongoDB (0) | 2023.04.10 |


